Your ability to deliver actionable intelligence rests on your understanding of the problem you’re facing, but big challenges stand in the way, such as:
- How to prioritise an increasing quantity and complexity of threats
- An overload of available data, but tools aren’t keeping up to help you make sense of it
- A rising number of stakeholders and priority intelligence requirements (PIRs) and increasing business value expectations from intelligence
Treemap visualisations to the rescue
One of the most powerful analytical tools in threat intelligence production to help with these problems is a treemap visualisation. Treemaps use nested rectangles to represent hierarchical data. This makes them ideal for visualising large amounts of data in a way that is easy to understand and interpret. You can create these with spreadsheets if you have a few hours to spare each day, or you can create them in a click with Silobreaker. They can then be populated with an aggregated source set of data across OSINT, the deep and dark web and finished intelligence providers for an accurate picture of the threat landscape.
Treemaps now available on Silobreaker
Now available alongside a range of threat intelligence analytics, treemaps allow Silobreaker customers to visualise large amounts of data in an easy-to-understand way. They also help Threat Intelligence teams to identify patterns and trends, prioritise threats and communicate threat intelligence to non-technical audiences.
Popular uses of Treemaps for threat intelligence production
Identify trending threat actors and techniques
Visualise the relationships between different threat actors and the malware and other tactic, techniques and procedures they are using to understand the threat landscape you face and develop mitigation strategies.
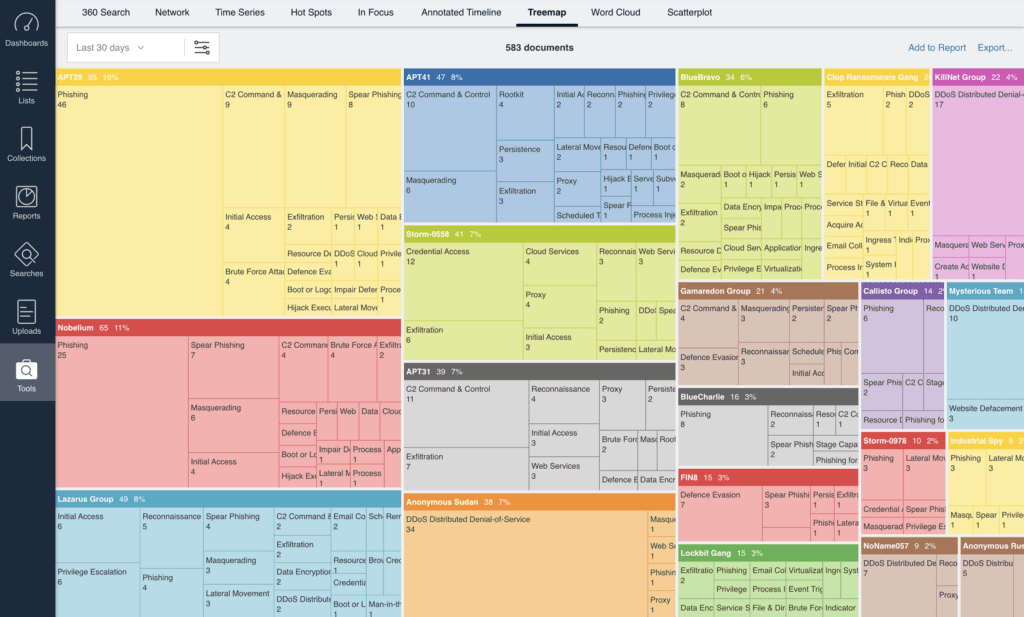
This image shows how Silobreaker Treemaps create a fast and powerful way to map threat actors and TTPs to the Enterprise MITRE ATT&CK framework.
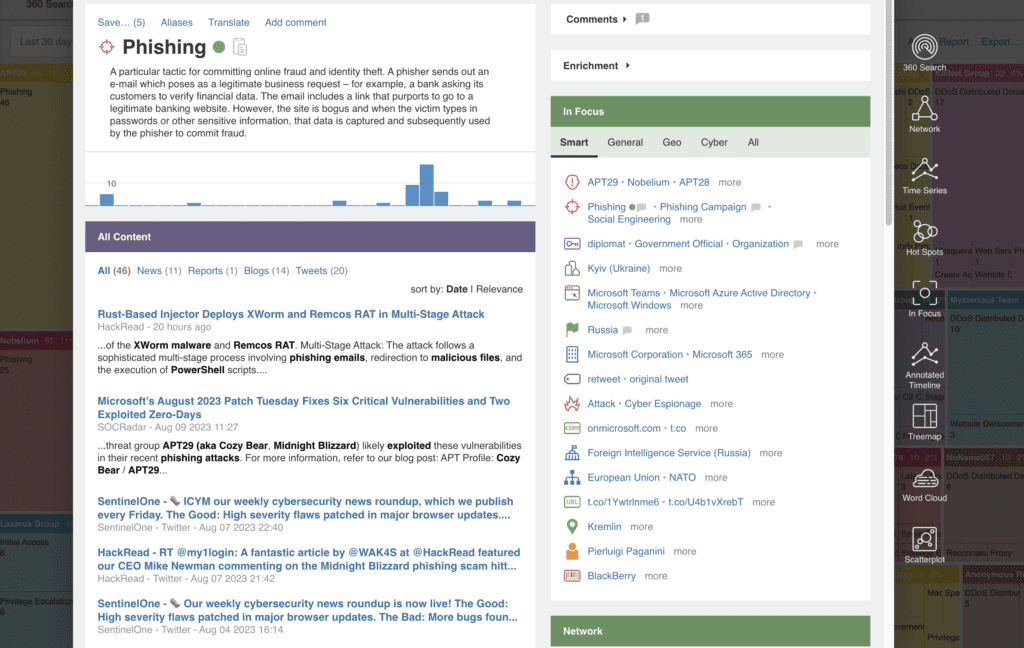
In one click, you can drill into the threat actor group name or TTP – in this case ‘Phishing’ – to investigate related content and spikes in activity.
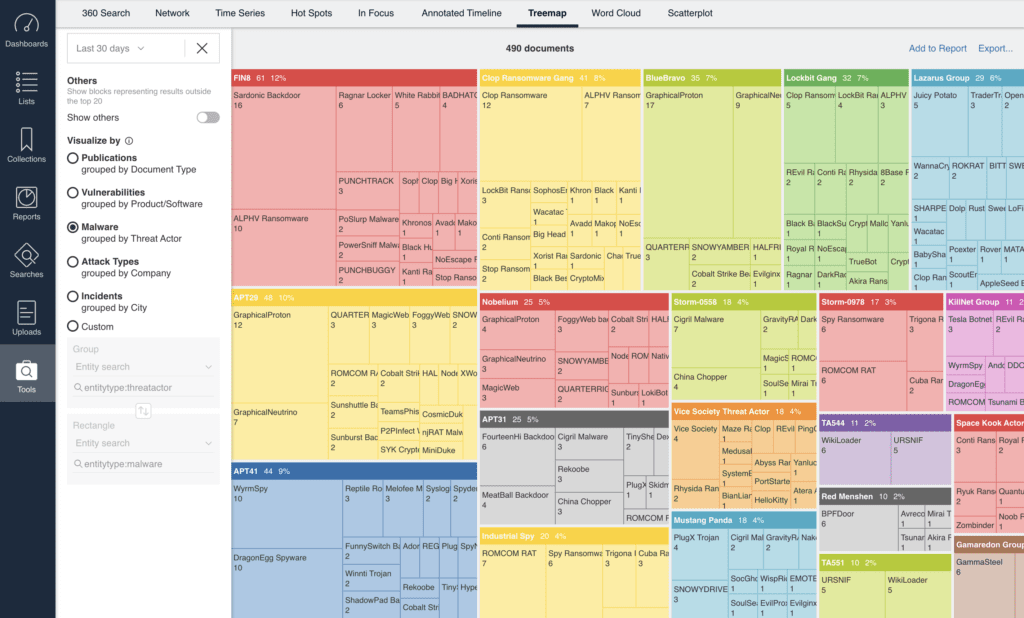
Silobreaker Treemaps aren’t only available with the custom queries that we support you in building. Our simple pre-set options provide powerful insights immediately, such as identifying the malware variants used by individual threat actors.
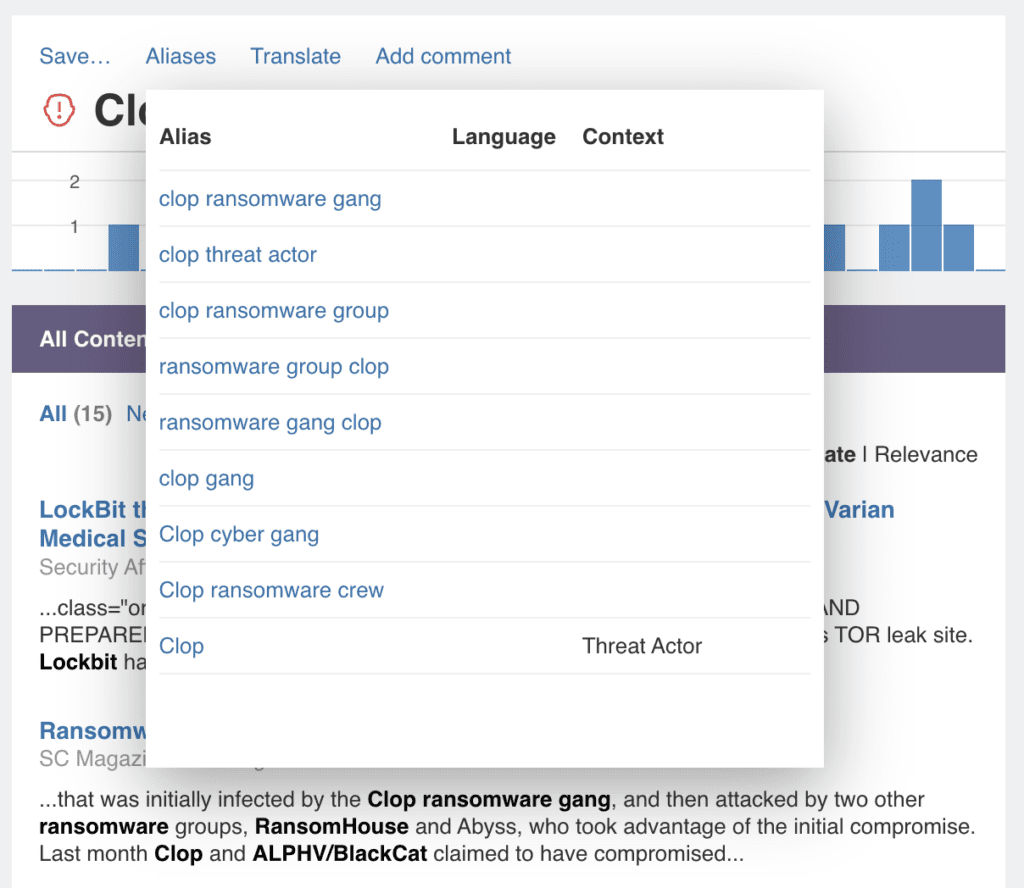
But as you know, threat actors have many different names, either because individual vendor analysts call them different things or because they show up in multiple forums under various guises. So how does the treemap make sure you report accurately? Well, from a processing perspective, our analysts continually identify all threat actor group aliases and add them to the entity, which means that when you see ‘Clop Ransomware Gang’, you are in fact searching on all these identified aliases. From a collection perspective, this means you’re getting a more inclusive and accurate result related to your query.
Once created, Silobreaker Treemaps can easily be added to reports and alerts created on the Silobreaker platform to feed this prioritised view of trending threats in a clear way for Red teams for emulation and Blue teams for better context in defence.
Let’s get back to treemap use cases…
Prioritise vulnerabilities with the highest risk
Vulnerability prioritisation has always been one of Silobreaker’s most popular intelligence requirements – but how do you confidently prioritise thousands of CVEs to focus on the five that will do you harm? Our Project Library of over 150 analyst-prepared monitoring dashboards gives you a great place to quickly get started, aggregating relevant content from OSINT, including Vuldb and Nvd, deep and dark web sources and premium finished intelligence sources. A range of analytics (just two of which are shown below) then help prioritise vulnerabilities.
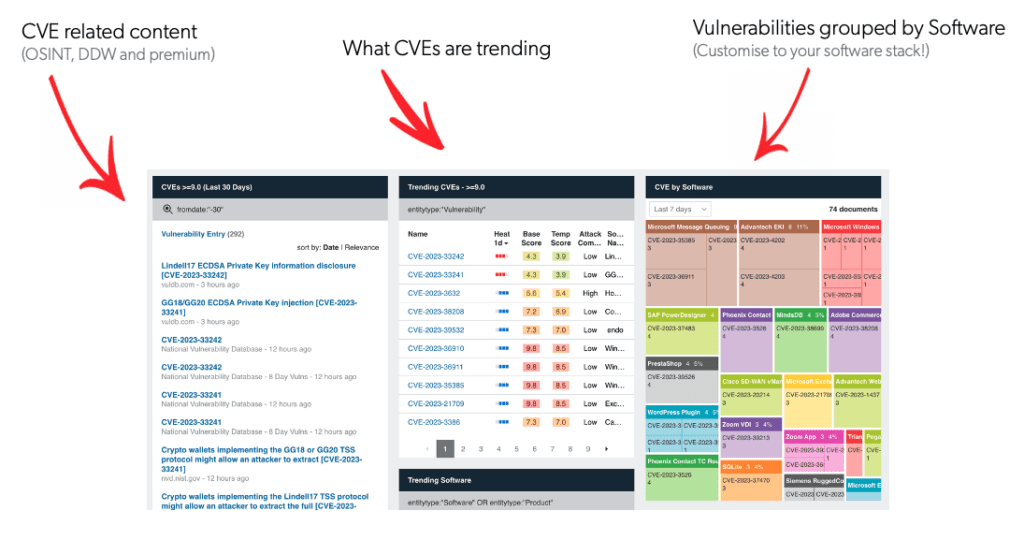
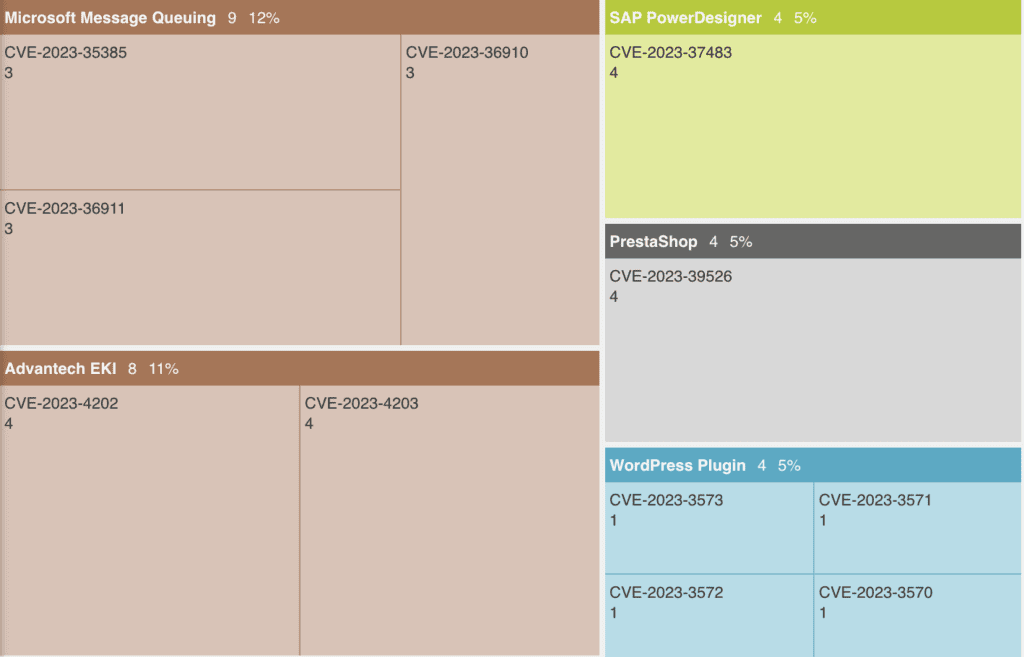
Silobreaker Treemap analytics for vulnerability intelligence take this analysis a level deeper to identify the vulnerabilities relevant to your specific tech stack. To get a picture of vulnerabilities specific to your organisation, simply feed in a list of your technologies (the products and software you use) into Silobreaker – or use a vulnerability scanner to get the output of CVEs.
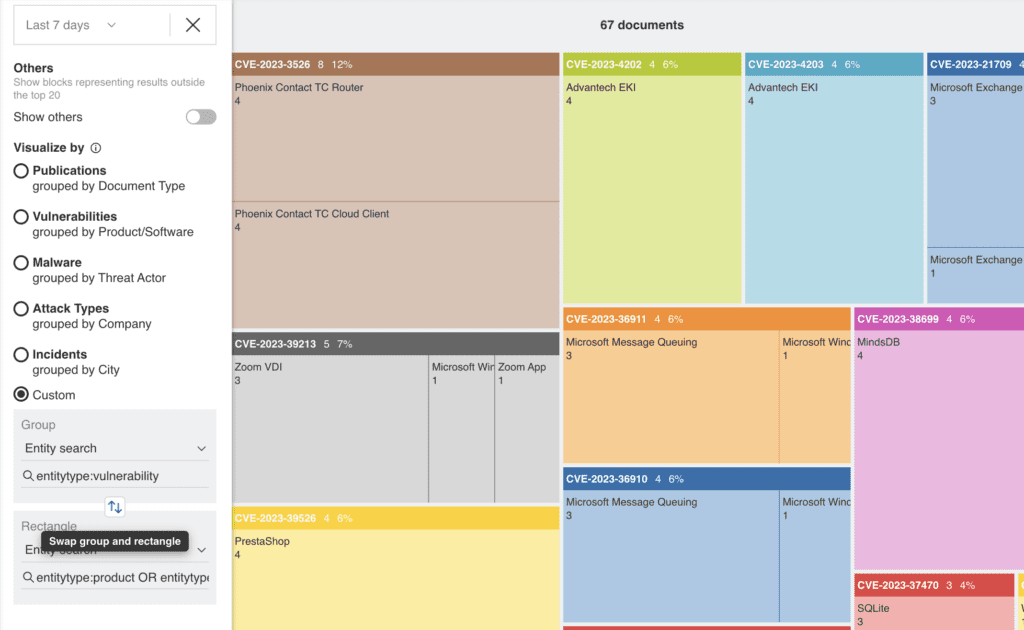
This view (or any treemap output) can be customised to switch the entities, document types, languages and publications you select for your treemap visualisation. In this view, switching CVEs to the top level identifies multiple products at risk from the same CVEs.
Visualise the distribution of threats
Because the Silobreaker data set is so diverse, automatically collecting data across OSINT sources, the deep and dark web and premium providers, our platform supports intelligence teams to cover a broader range of intelligence requirements in one place – from cyber threats to geopolitical events and even physical security risks – as well as the connections between them all.
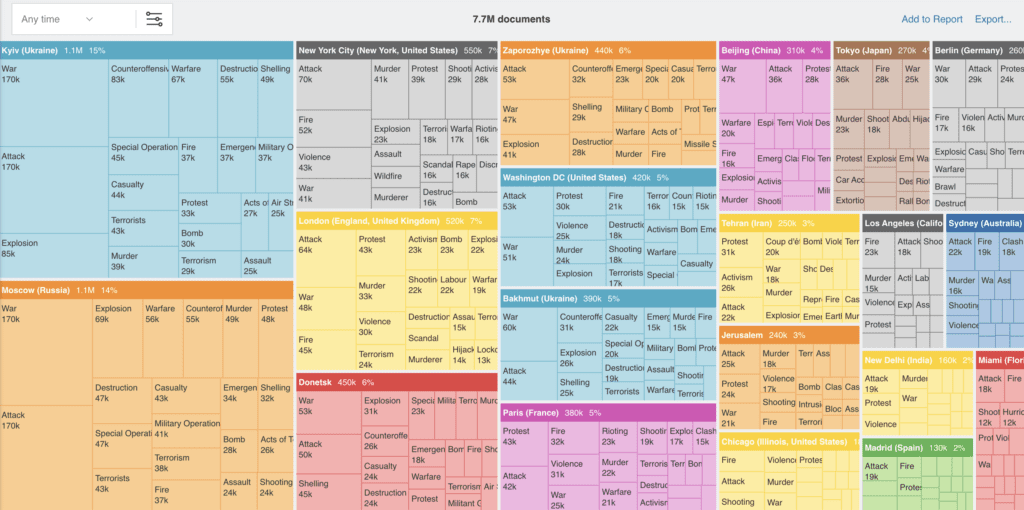
That means Silobreaker Treemaps can be customised to visualise the distribution of threats across different countries, industries and attack vectors. This can help analysts to identify areas of high risk and focus their resources accordingly.
From the attack types targeting your brand…
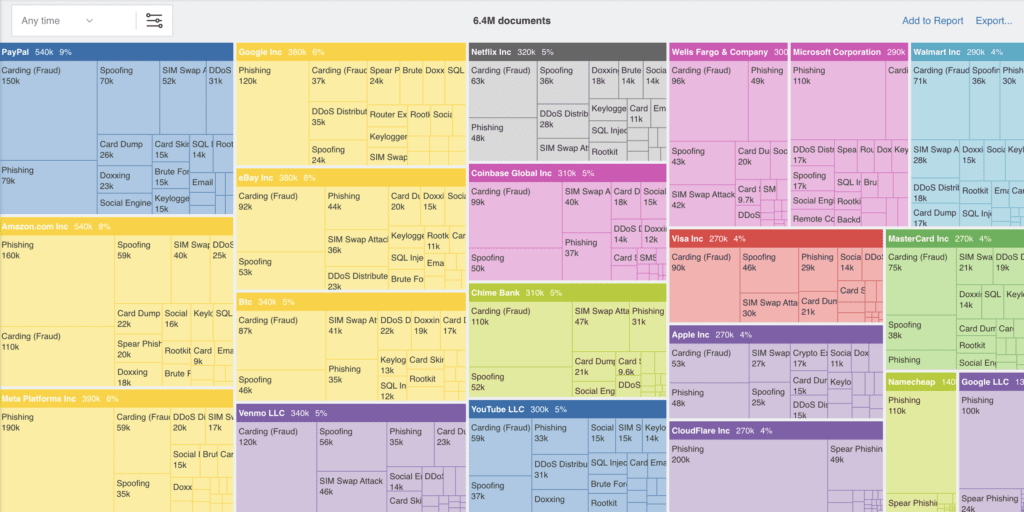
To incidents in specific regions, countries or cities across the globe.
Overall, the use of treemap visualisations in threat intelligence production is a powerful and flexible tool that can be used to improve the understanding, communication and efficiency of threat intelligence production. By making threat data more visually appealing and easier to understand, treemaps can help analysts to share their findings with other stakeholders and make more informed decisions about how to prioritise risks and protect their organisations from cyber threats, geopolitical events and physical security risks.
Existing customers can start building treemaps today from the Tools menu in their Silobreaker account with help guides available here. If you’re new to Silobreaker, you can learn more about the Silobreaker threat intelligence platform here or get in touch here.
